-
-
Low carbon energy-saving intelligent management system for energy users
- Product introduction
On the basis of energy supervision platform, timeWave network has added a docking module with Wuhan low-carbon energy-saving intelligent management platform. Summarize the total energy consumption (level 1) of energy consuming units, the energy consumption of each circuit (level 2) and the energy consumption of key areas/buildings, processes and equipment (level 3). After encryption, it is automatically uploaded to the municipal low-carbon energy-saving intelligent management platform through the Internet at regular intervals.
- Details
-
According to the requirements of Wuhan Municipal Party Committee and Government (WF [2017] No. 25) and other documents, accelerate the construction of low-carbon energy-saving intelligent management system (i.e. online energy consumption monitoring system) for key energy users in the city.On the basis of energy supervision platform, timeWave network has added a docking module with Wuhan low-carbon energy-saving intelligent management platform. Summarize the total energy consumption (level 1) of energy consuming units, the energy consumption of each circuit (level 2) and the energy consumption of key areas/buildings, processes and equipment (level 3). After encryption, it is automatically uploaded to the municipal low-carbon energy-saving intelligent management platform through the Internet at regular intervals. At the same time, the energy consumption unit also monitors the energy consumption environment of the power distribution room. Through the subdivision and statistics of all energy consumption at the user end, the use and consumption of various types of energy can be displayed to the management or decision-making level with intuitive data and charts. It is convenient to find out high energy consumption points or unreasonable energy consumption habits, and effectively save energy. Provide accurate data support for users to further energy-saving transformation or equipment upgrading.
Application sites:
(1) Park and factory;
(2) Office buildings (business office buildings, state office buildings, etc.);
(3) Commercial buildings (shopping malls, financial institutions, etc.);
(4) Tourist buildings (hotels, entertainment places, etc.);
(5) Science, education, culture and health buildings (culture, education, scientific research, medical and health, sports buildings, etc.);
(6) Communication buildings (post and telecommunications, communication, radio, television, data center, etc.);
(7)Transportation buildings (airport, station, wharf, etc.);
Introduction to system functions and features:
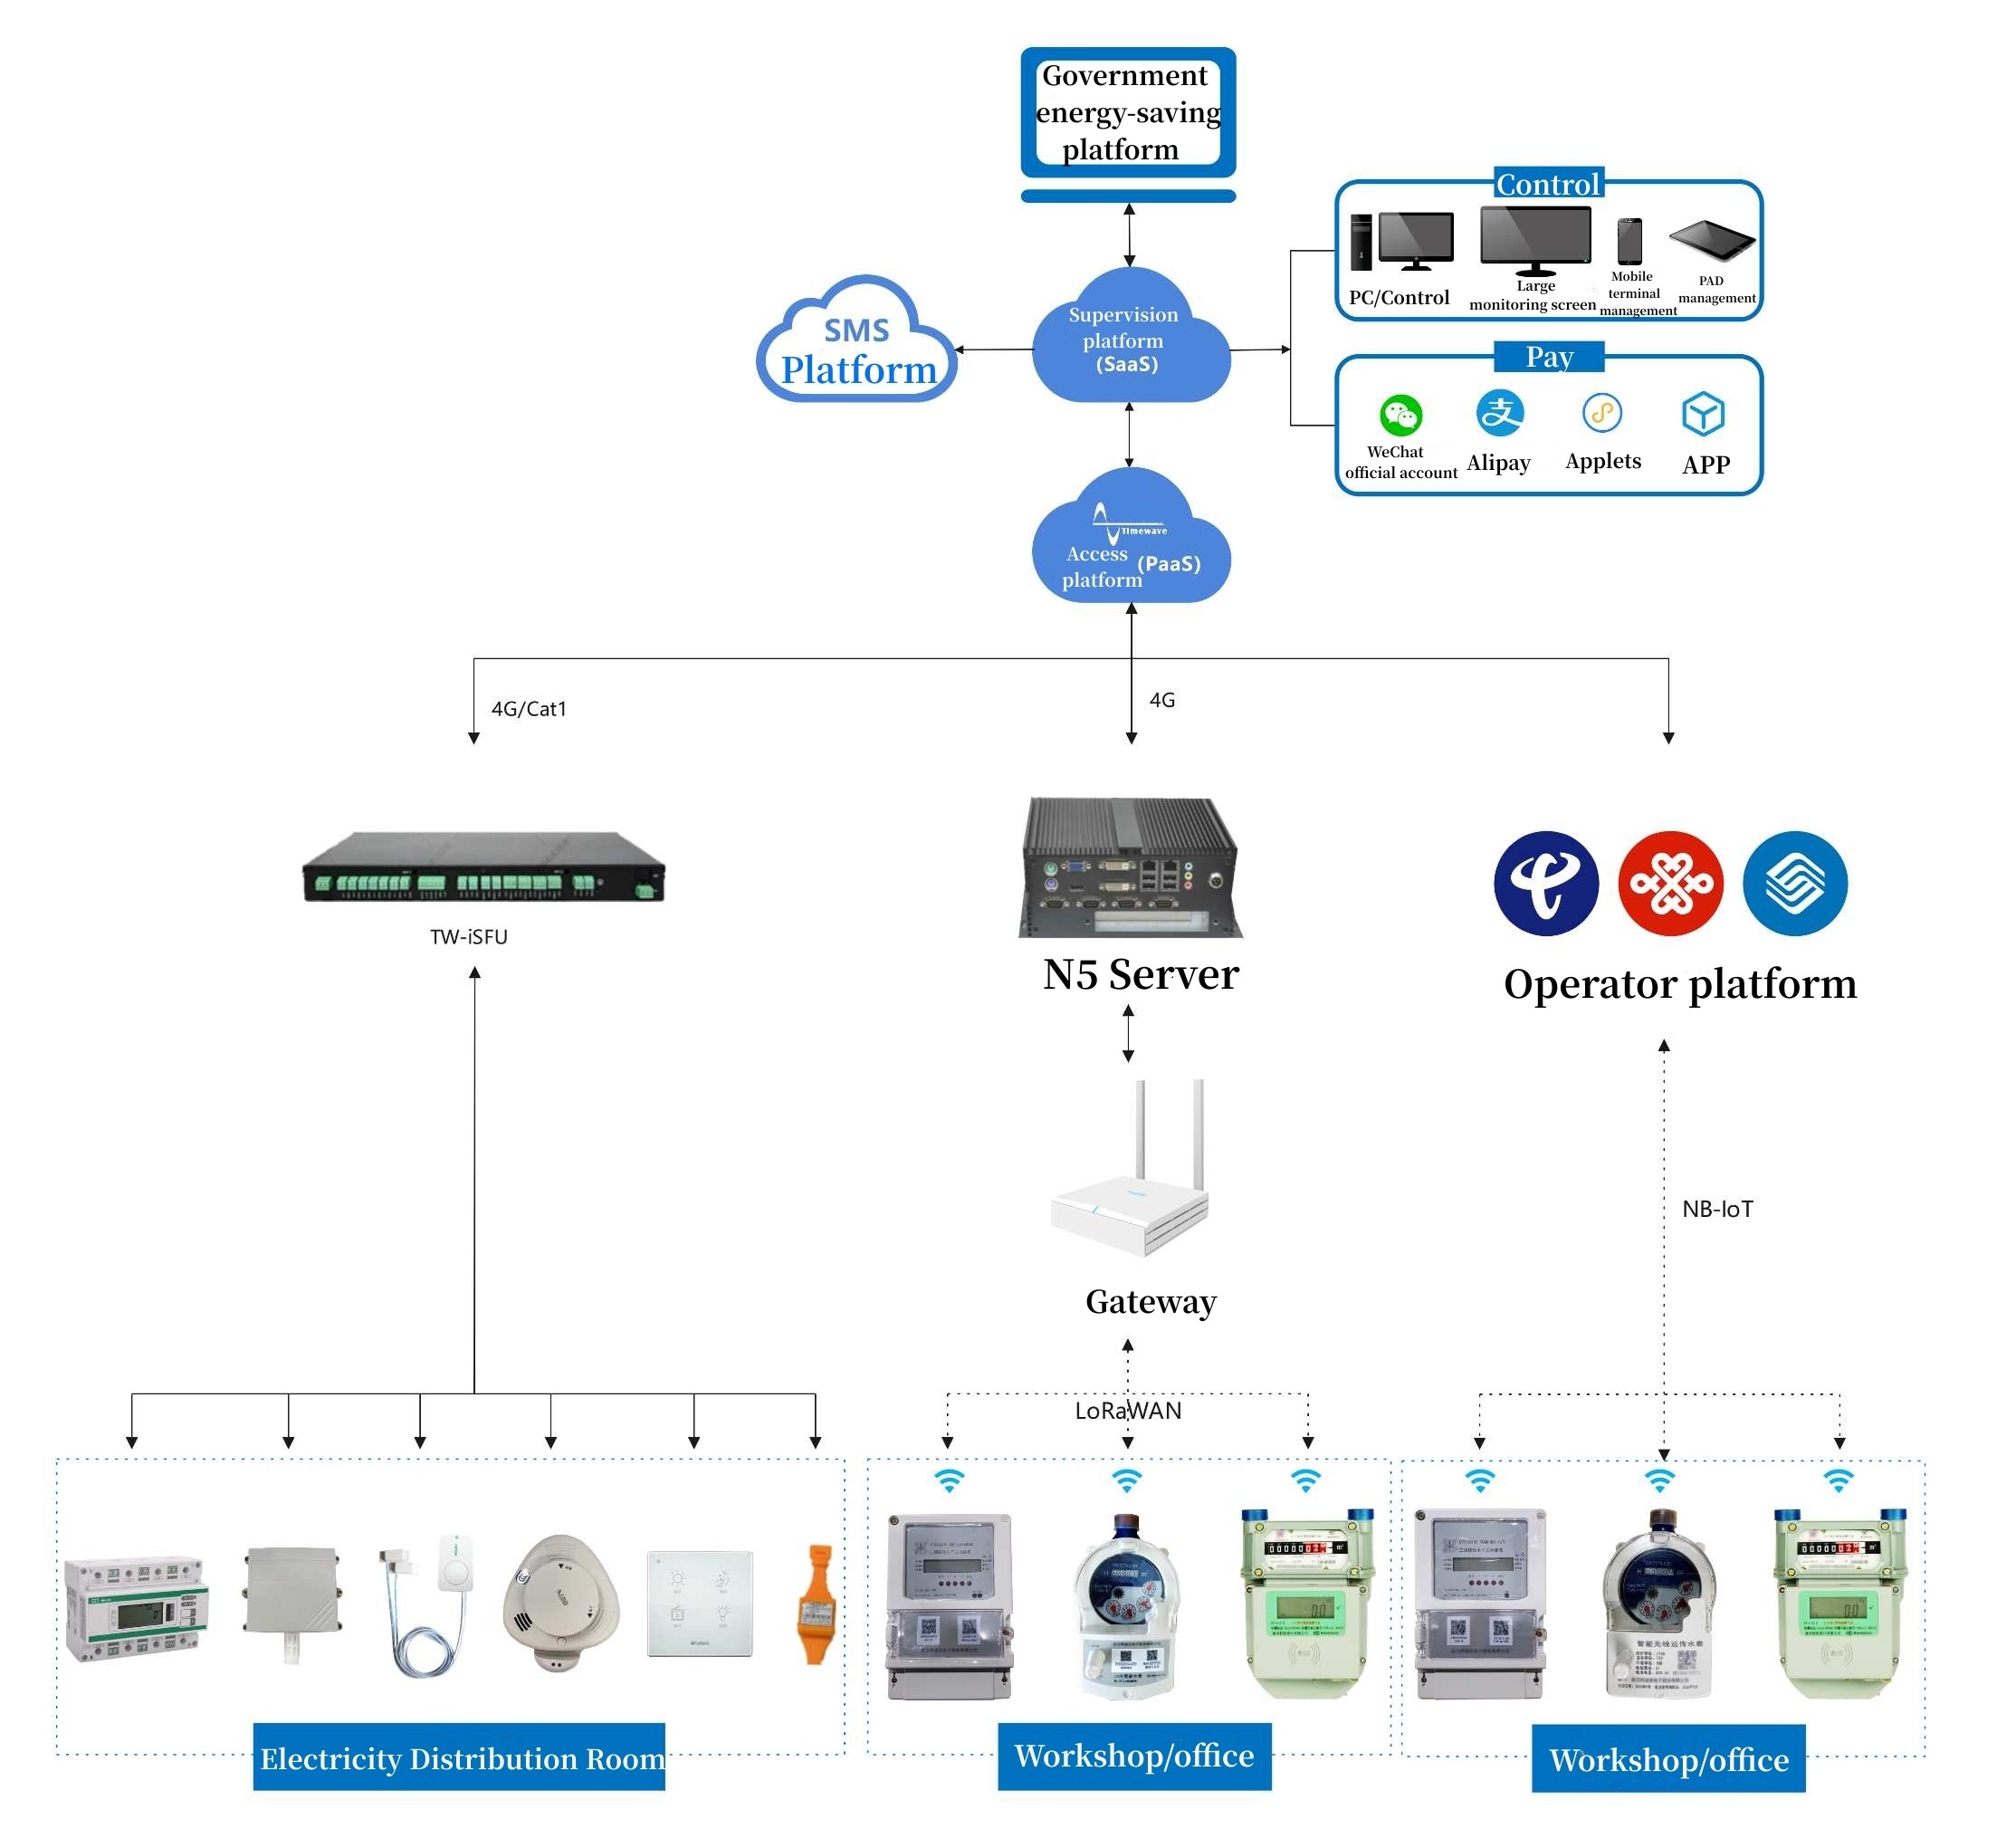
1. Architecture: B/S architecture+applet/APP+standard API;
2. System composition: meter reading system, energy consumption system,distribution room energy consumption power environment monitoring system, municipal platform docking system;
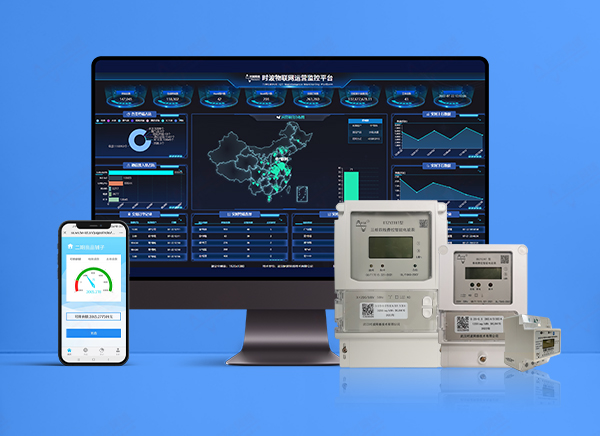
3. Large screen kanban: the kanban page summarizes the basic information of the enterprise, daily/monthly/annual energy consumption per ton of standard coal, daily/monthly/annual energy consumption, as well as key energy consumption and energy consumption ranking;
4. Energy consumption ranking: the energy flow chart shows the composition of enterprise energy consumption more intuitively in a graphical way. Quickly locate the energy category with high proportion of energy consumption;
5. Energy consumption statistics: hourly electricity, cost and proportion are calculated by day, month and year;
6. Key energy consumption: make statistics on energy consumption of each production process of the enterprise by day, month and year. The energy consumption per ton of standard coal is converted according to the conversion coefficient;
7. Product unit consumption: the energy consumption of each product of the enterprise is calculated by day, month and year. Combined with the output data, calculate the unit consumption of the product;
8. Key equipment: the energy consumption of key energy consuming equipment of the enterprise shall be calculated by day, month and year. The energy consumption per ton of standard coal is converted according to the conversion coefficient;
9. Centralized metering and reading: remote centralized reading of data from meters, water meters, flow meters and other measuring instruments;
10. Energy consumption statistics: calculate the energy consumption data by day, month and year based on the meter reading data;
11. Manual filling: for some energy (such as coal, oil, etc.) that cannot be remotely collected through measuring instruments, the function of manual filling in energy data is provided;
12. Trend analysis: the daily, monthly and annual energy consumption trends of energy categories, processes and key energy consuming equipment are displayed visually in the form of histogram;
13. Comparative analysis: analyze the energy consumption of energy categories, processes and key energy consuming equipment on a year-on-year and month on month basis;
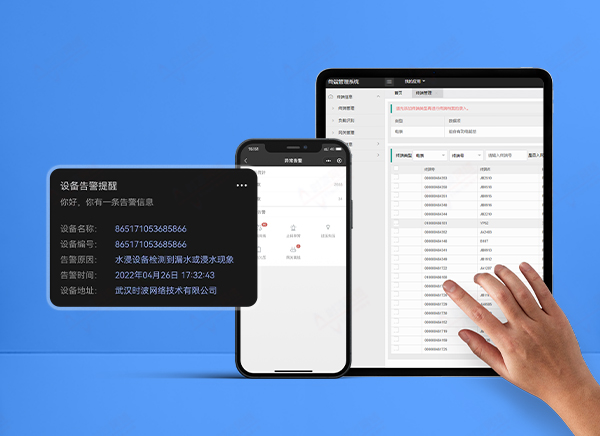
14. Energy consumption warning: when the energy consumption exceeds the historical data of the same period, the preset maximum consumption per unit time, national standards, etc., the system will actively remind;
15. Power distribution monitoring: real-time online monitoring of power distribution and environmental conditions of the whole plant (voltage, current, power, electric energy, temperature and humidity, etc.);
16. Real time early warning: the system can monitor the operation status of power supply and distribution equipment,voltage,current,power,power factor, environmental conditions and other events in real time. And send alarm according to the event level;
17. File information: On the key energy consuming equipment information page, you can configure the production operation and operation unit of the equipment, and select the classification; And some basic information about equipment installation location, equipment department, equipment operation, equipment manufacturer, etc;
18. Data storage: data will be stored in the database after calculation and analysis. The user can call up and view the previous energy consumption data at any time;
19. Data transmission: data is not only for internal management of enterprises. The state requires high energy consuming enterprises to establish an online energy consumption monitoring system to monitor the energy consumption of high energy consuming enterprises. The data needs to be connected to the government platform and transmitted;
20. Assessment report: generate operation diagnosis report according to relevant configuration and put forward suggestions for energy saving improvement;
21. Platform opening: support customized development, docking with private cloud and private agreement
Introduction to system architecture:
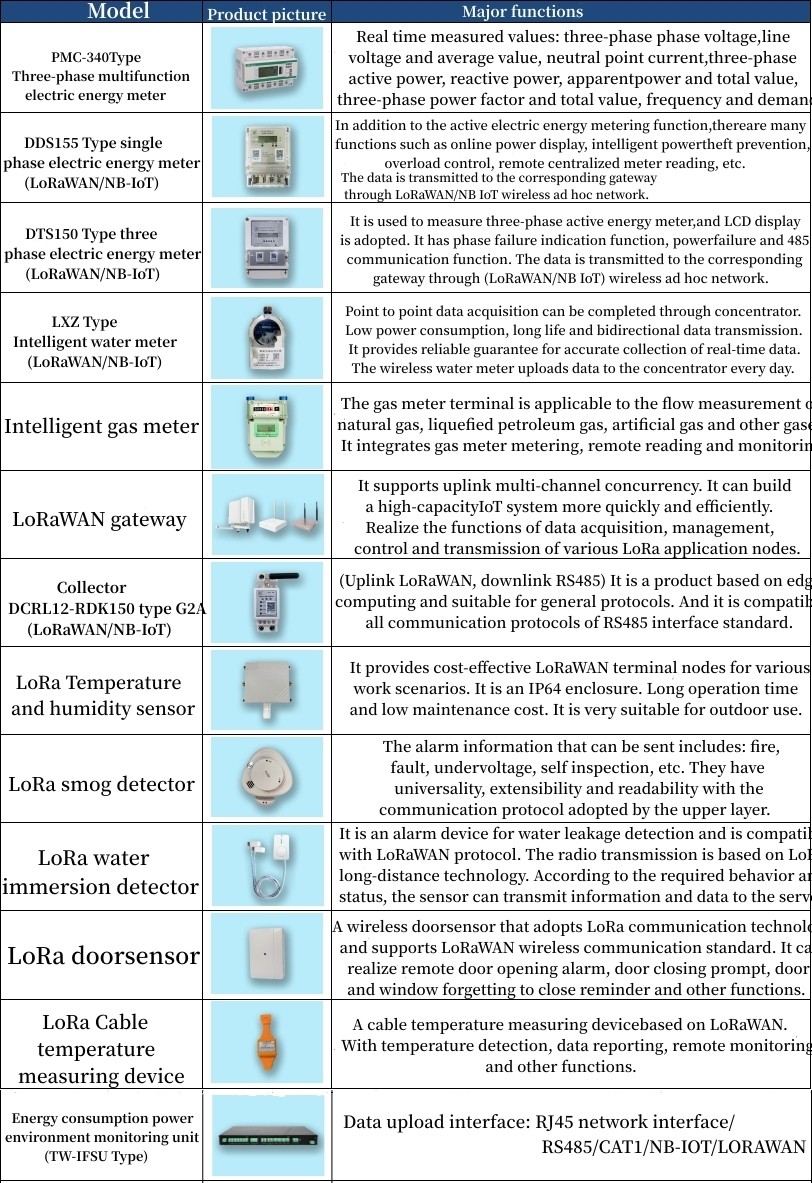
Hardware product introduction:
Introduction to SaaS application platform system interface:
PC terminal interface
The system is divided into three main functional modules, including terminal data, energy consumption monitoring and power distribution monitoring. Select three parts of the interface to introduce.
Home page of terminal management system
(1) Show users the quantity and total consumption of terminals such as water meter and electricity meter.
(2) Count the electricity and water consumption of today, last day, this month and last month. Whether the consumption increased or decreased year on year.
Project information alarm: including the number of communication interruptions, the number of abnormal stop codes, and the number of over-voltage/loss of voltage of meters. And the number of over pressure/pressure loss of water meter.
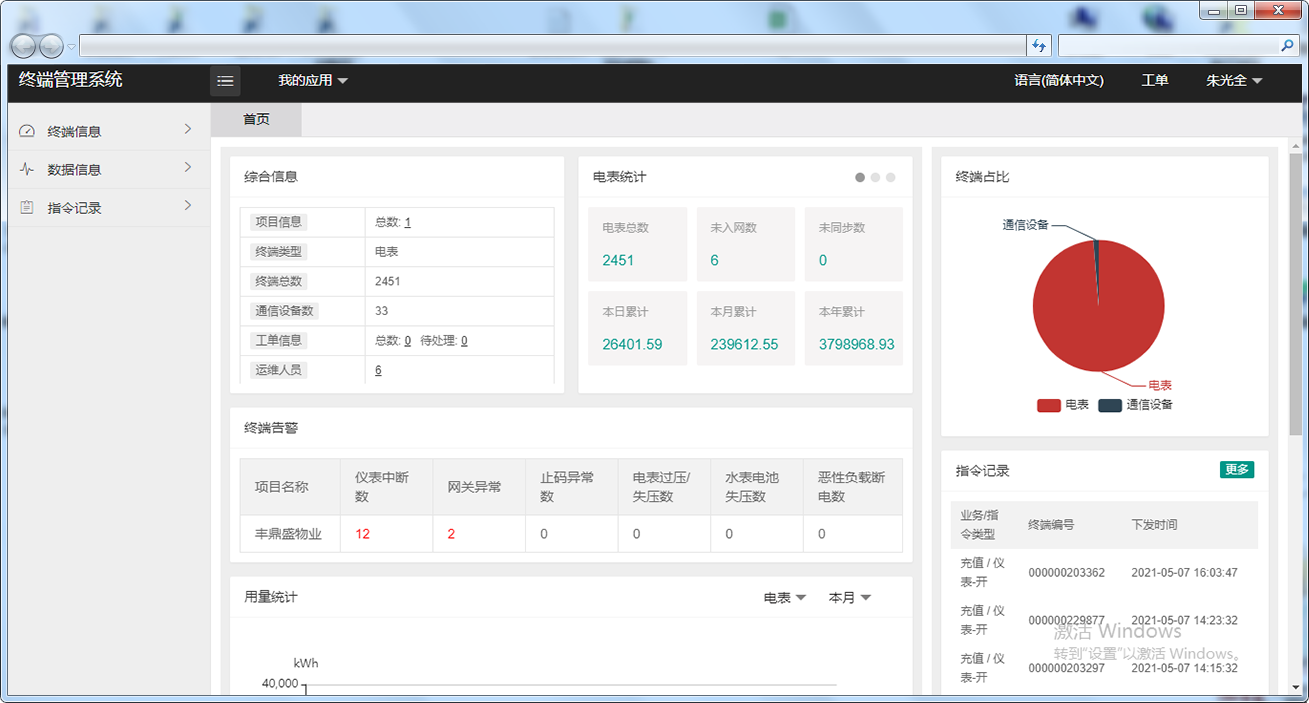
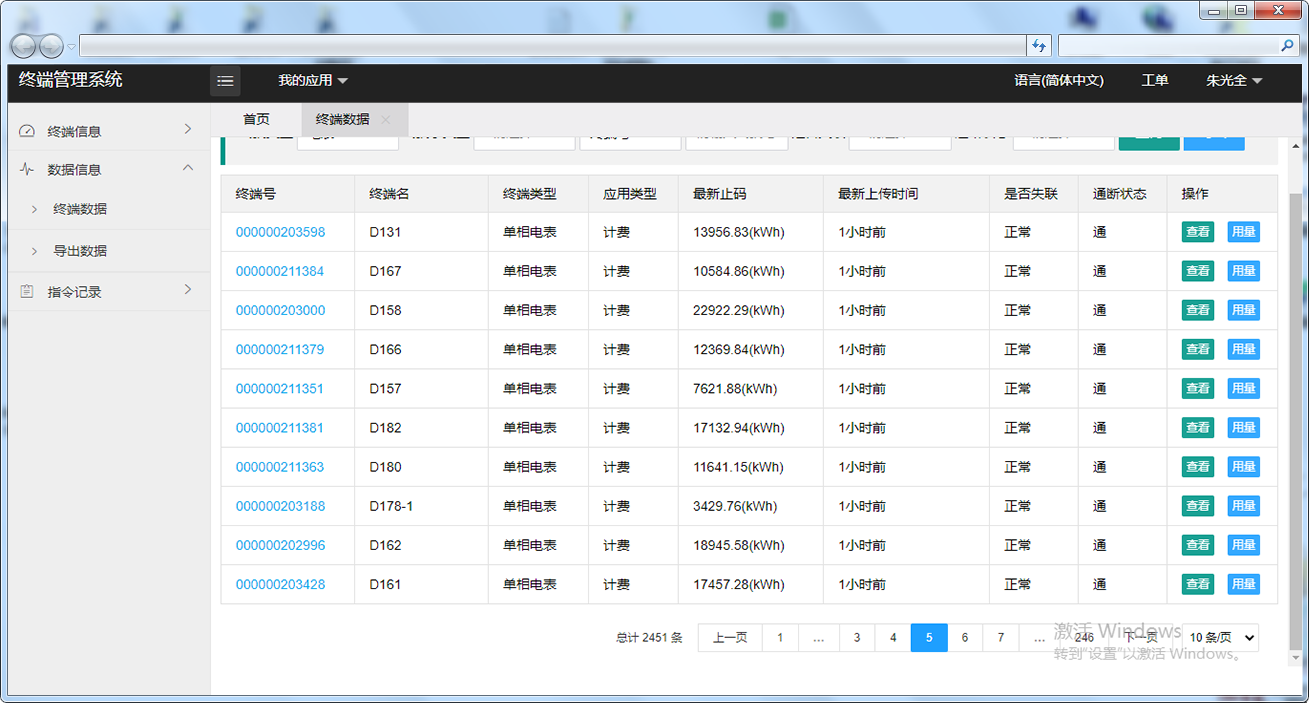
Terminal data: mainly constructs the basic information of terminal meter, including terminal information, data information and instruction records.
Energy consumption monitoring
Energy consumption reflects the consumption of a region. Energy consumption is divided into 6 modules, which are home page, monitoring point management, monitoring data, consumption statistics, consumption comparison and consumption analysis.
The home page contains daily cumulative usage, monthly cumulative usage, annual cumulative usage, terminal quantity, usage trend, current month cumulative usage, and usage trend comparison.
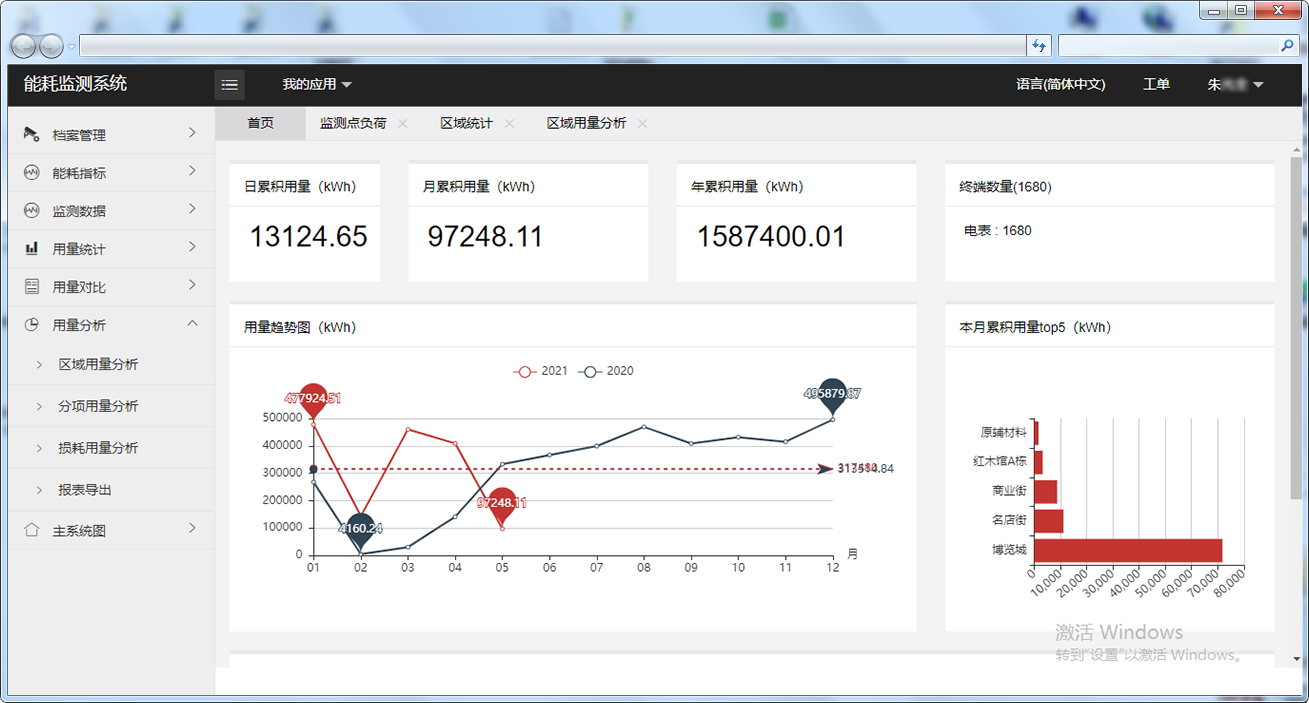
Enter the regional energy consumption statistics page, and select the corresponding region and time to query the energy consumption statistics under this region.

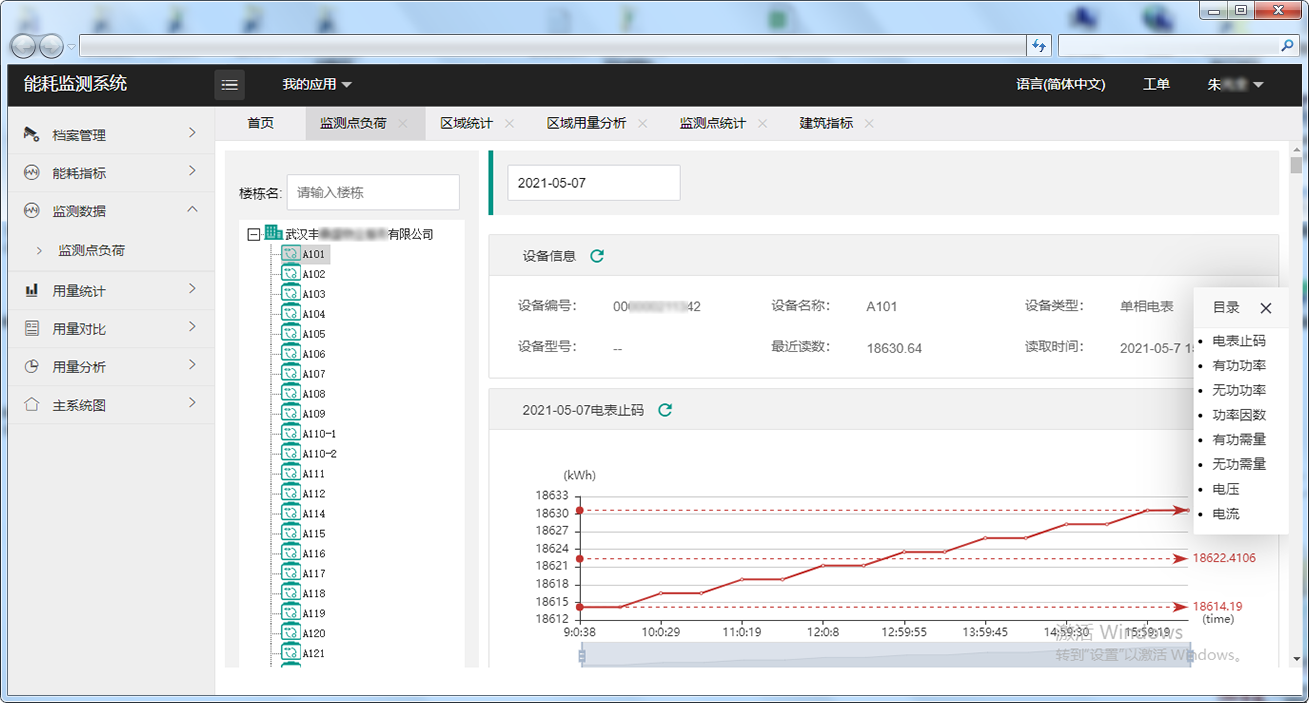
Enter the load page of monitoring point to query the information of relevant load items monitored.
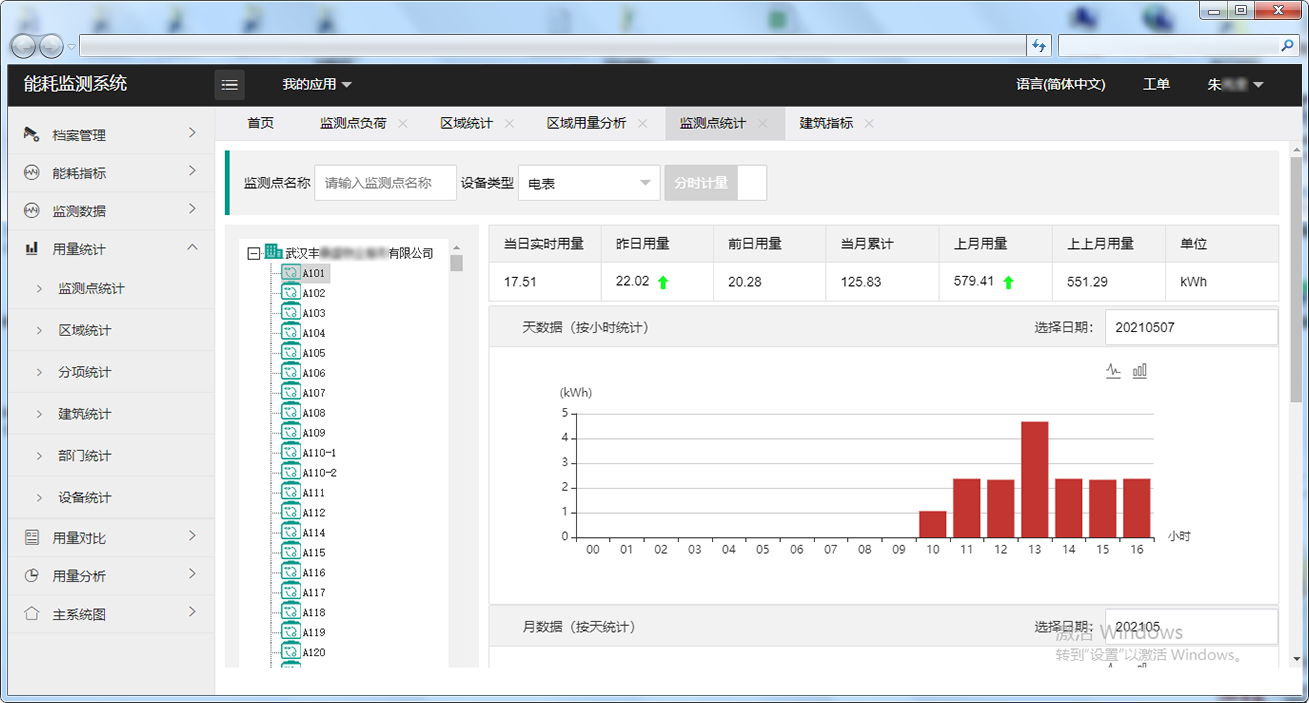
Enter the monitoring point statistics page. Enter the name of the monitoring point to query relevant information.
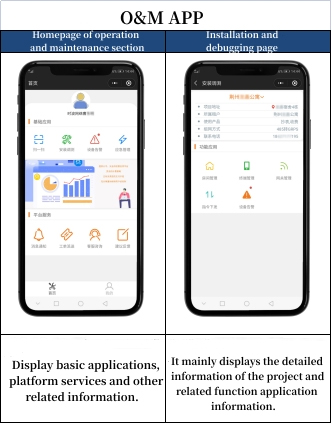
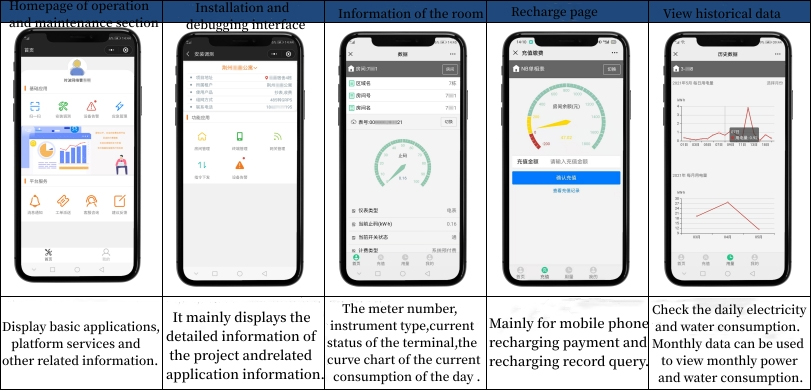
Mobile terminal interface
Large screen display homepage of energy supervision platform
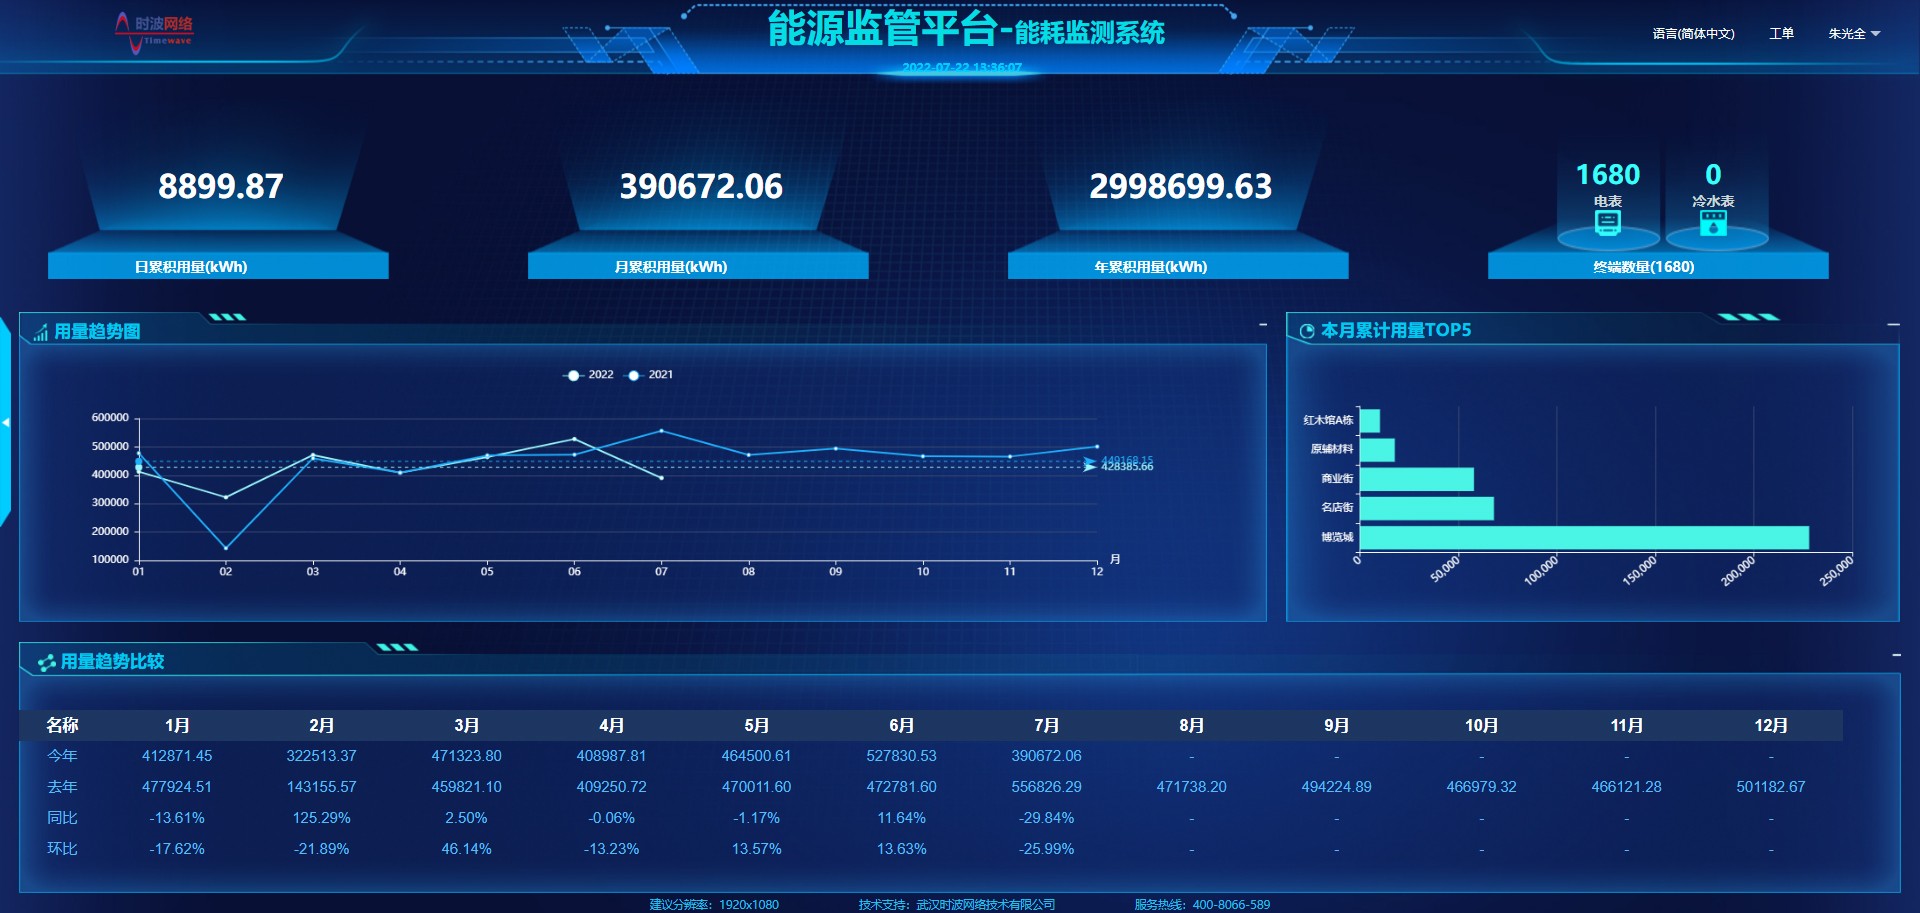
(1)The large screen can display the real-time situation and relevant data of the rotating energy consumption monitoring of the power distribution room, and can also add customized enterprise LOGO and enterprise information overview.
(2)Statistics of system operation days, number of stations, current load, hourly usage of the day, cumulative usage, daily alarm, daily/monthly/annual comprehensive energy consumption, daily/monthly/annual energy consumption cost and other information.
(3)It can focus on the monitoring quantity of energy consumption equipment, the monthly statistics of energy consumption Top5, the total capacity of transformers, and the monthly electricity consumption/monthly cost.
You may like
-
 Online service
-
 Hotline
-
 WhatsApp
-


