-
-
Energy consumption monitoring, analysis and management system
- Product introduction
TimeWave energy consumption monitoring and analysis system is based on \"four meters in one\" information acquisition (meter reading). Through the subdivision and statistics of all energy consumption at the user end, it is possible to show the use and consumption of all kinds of energy to the management or decision-making level with intuitive data and charts. It is convenient to find out high energy consumption points or unreasonable energy consumption habits, and effectively save energy. Providing accurate data support for users to further energy-saving transformation or equipment upgrading.
- Details
-
Energy consumption monitoring and analysis system is based on "four meters in one" information acquisition (meter reading). Through the subdivision and statistics of all energy consumption at the user end, it is possible to show the use and consumption of all kinds of energy to the management or decision-making level with intuitive data and charts. It is convenient to find out high energy consumption points or unreasonable energy consumption habits, and effectively save energy. Providing accurate data support for users to further energy-saving transformation or equipment upgrading.
Application site:
(1) Office buildings (business office buildings, state office buildings, etc.);
(2) Commercial buildings (shopping malls, financial institutions, etc.);
(3) Tourist buildings (hotels, entertainment places, etc.);
(4) Science, education, culture and health buildings (culture, education, scientific research, medical and health, sports buildings, etc.);
(5) Communication buildings (post and telecommunications, communication, radio, television, data center, etc.);
(6) Transportation buildings (airport, station, wharf, etc.);
Introduction to system functions and features:
1. Architecture: B/S architecture+applet/APP+standard API;
2. System composition: meter reading system and energy consumption system;
3. Cloud deployment: the cloud is uniformly deployed, and the upgrade is convenient and fast. Customers do not need to install clients. The upgrade and maintenance of system software are no longer troubled by the customer's network environment;
4. System scale: the access table is not limited by quantity and region. One account can manage multiple projects, and the system design capacity exceeds 100000 metering points;
5. Project trusteeship: The project site can save a series of work such as configuring prepaid servers, installing databases, and SMS cats. It can not only save a lot of hardware costs, but also greatly reduce debugging and maintenance costs;
6. Real time monitoring: the system will monitor the energy consumption data and production status of the enterprise in real time during the production process of the enterprise. Users can keep abreast of the energy consumption and production status at all stages of the production process;
7. Calculation and analysis: the system will perform a calculation, analysis and processing on the data collected after detection. By comparing various indicators, or with previous data. It can provide enterprises with a reasonable and scientific reference scheme for energy optimization with data support;
8. Data storage: After calculation and analysis, the data will be stored in the database. The user can call up and view the previous energy consumption data at any time;
9. Data transmission: data is not only for internal management of enterprises. The state requires high energy consuming enterprises to establish an online energy consumption monitoring system in order to monitor the energy consumption of high energy consuming enterprises. Data needs to be connected to the government platform and transmitted;
10. Fault alarm: In the production process of the enterprise, if there is production equipment or unreasonable energy consumption. The system will give an alarm so that the management personnel can find the problem for reference and take an emergency measure against the fault;
11. Data display: After the establishment of the online energy consumption monitoring system, managers do not need to view the instruments on each production line, but only need to view the energy consumption information on the intelligent device through the monitoring page provided by the system. The display of energy consumption information can be presented in the way users like;
12. Energy conservation and emission reduction: Another purpose of building an online energy consumption monitoring system is to make our own contribution to the national sustainable development and the construction policy of energy conservation and emission reduction. The system can reduce the emission of enterprise pollutants;
13. Report statistics: provide users with classified and itemized energy consumption statistics and report printing, which can print and count the energy consumption (according to year, month and day);
14. Energy consumption indicators: provide configuration services for key indicators. Users can customize the indicators they care about;
15. Energy flow analysis: the system energy flow diagram is in the form of energy medium flow diagram. It visually summarizes the overall picture of the enterprise's energy system and reflects the balance relationship between the enterprise's energy input, distribution and transmission;
16. Ranking of energy consumption: energy consumption ranking can be statistically analyzed and ranked by region, energy consumption unit, etc. It supports positive and negative sorting, and can also be used as a basis for assessment. You can view the rankings of the current year, last year, current month, last month, and current day;
17. Platform opening: support customized development, docking with private cloud and private agreement;
Introduction to system architecture:
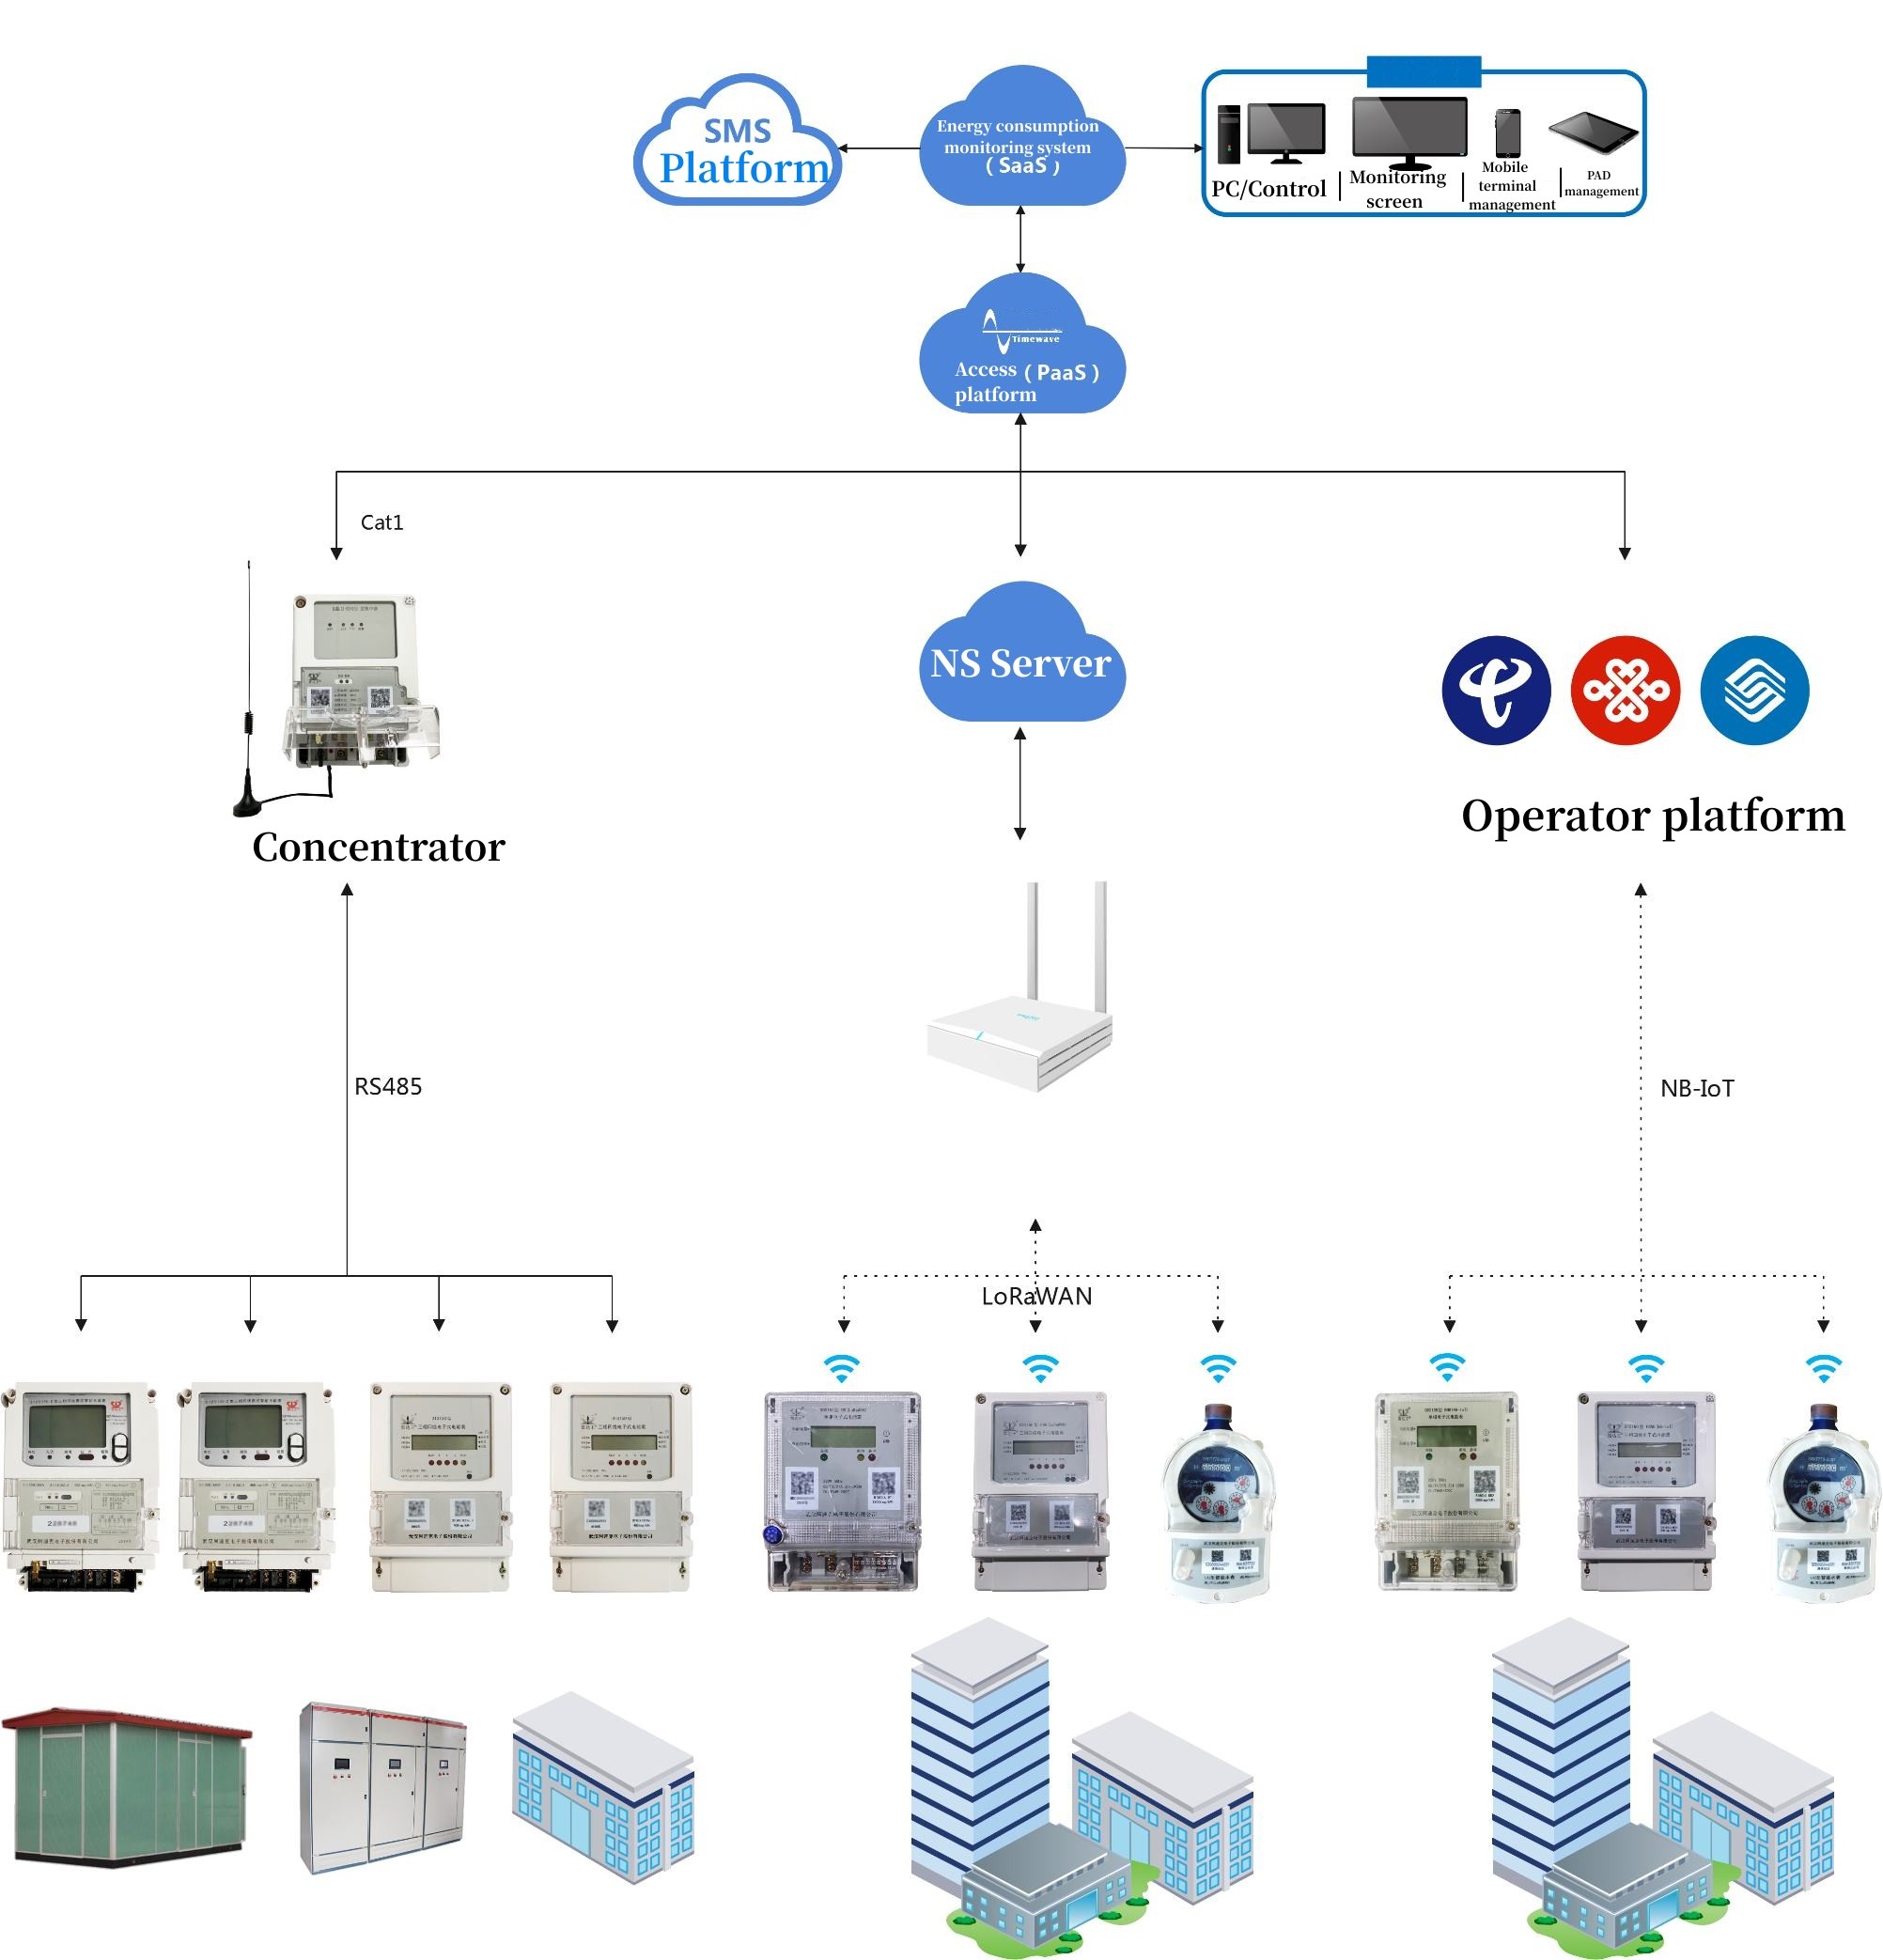
Hardware product introduction:
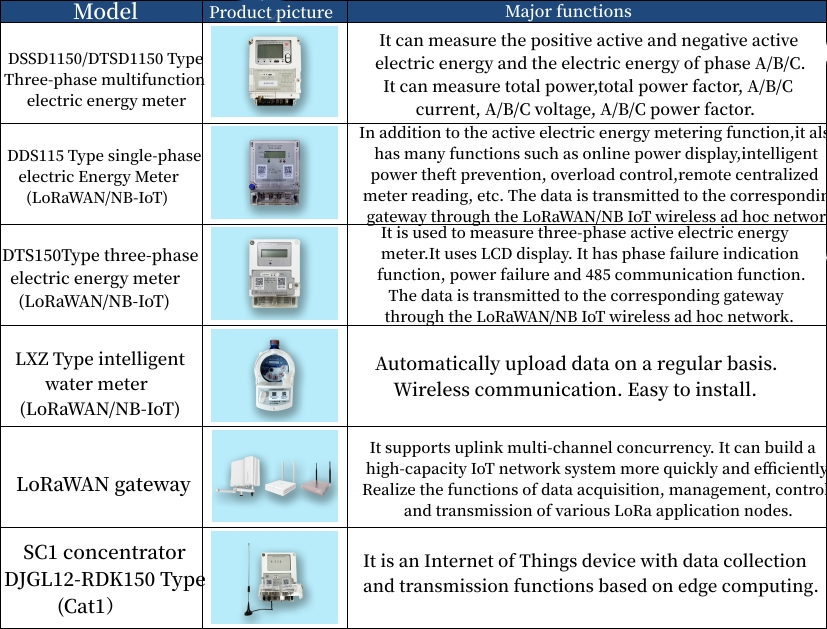
Introduction to SaaS application platform system interface:
PC terminal interface
The system is divided into two main functional modules, including terminal data and energy consumption monitoring. Selecting two parts of the interface to introduce.
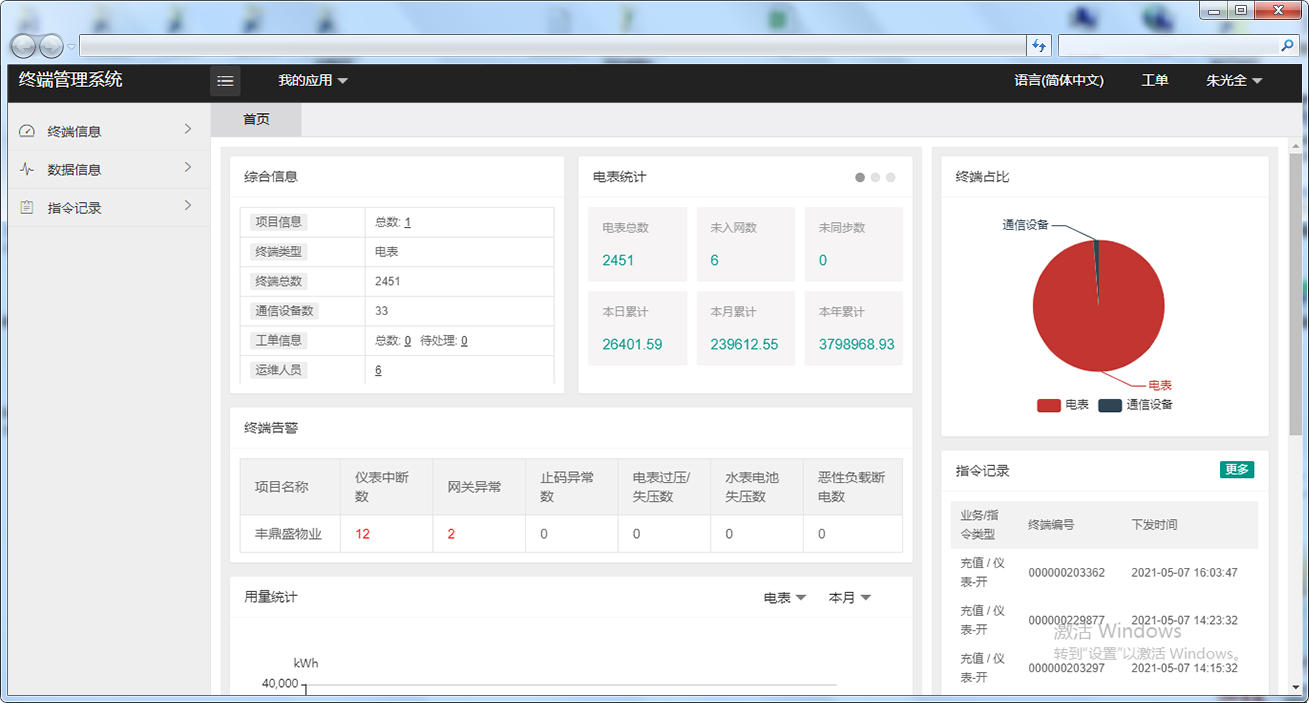
Home page of terminal management system
(1) Show users the quantity and total consumption of terminals such as water meter and electricity meter.
(2) Count the electricity and water consumption of today, last day, this month and last month. Whether the consumption increased or decreased year on year.
Project information alarm: including the number of communication interruptions, the number of abnormal stop codes, and the number of over-voltage/loss of voltage of meters. And the number of over pressure/pressure loss of water meter.
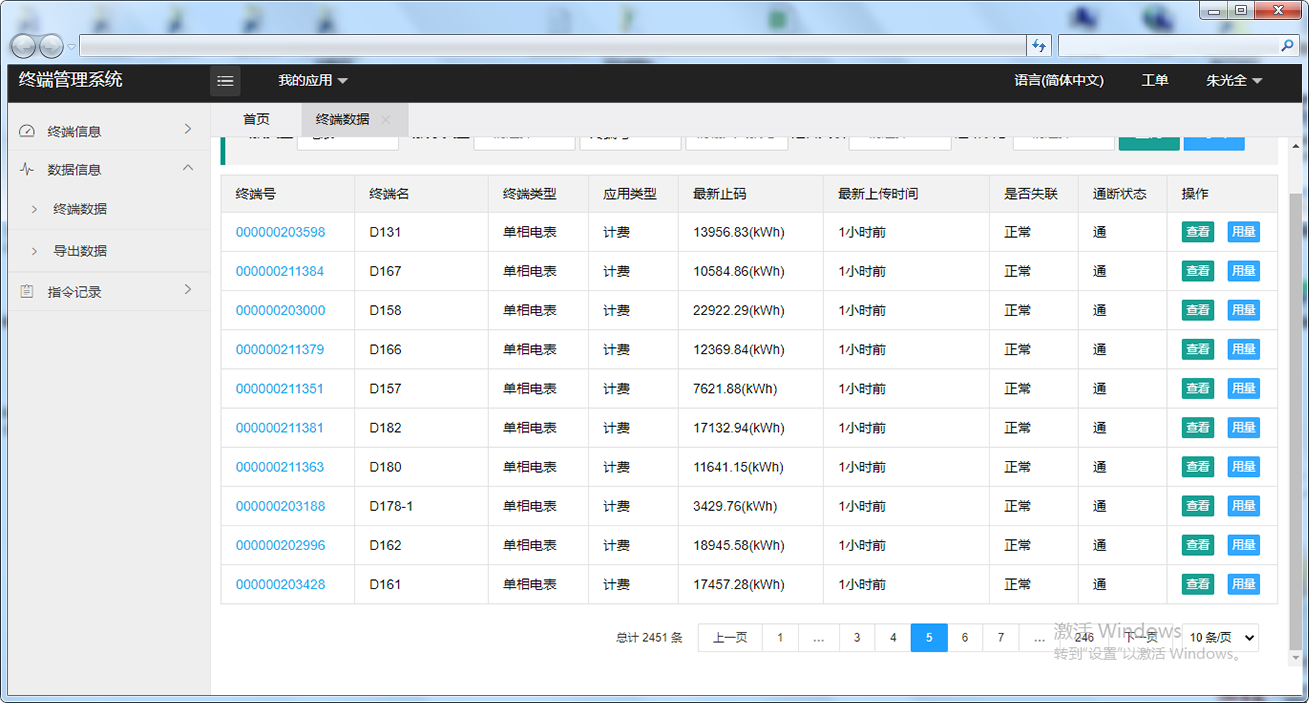
Terminal data: mainly constructs the basic information of terminal meter. It includes terminal information, data information and instruction records.

Energy consumption monitoring
Energy consumption reflects the consumption of a region. Energy consumption is divided into 6 modules, which are home page, monitoring point management, monitoring data, consumption statistics, consumption comparison and consumption analysis.
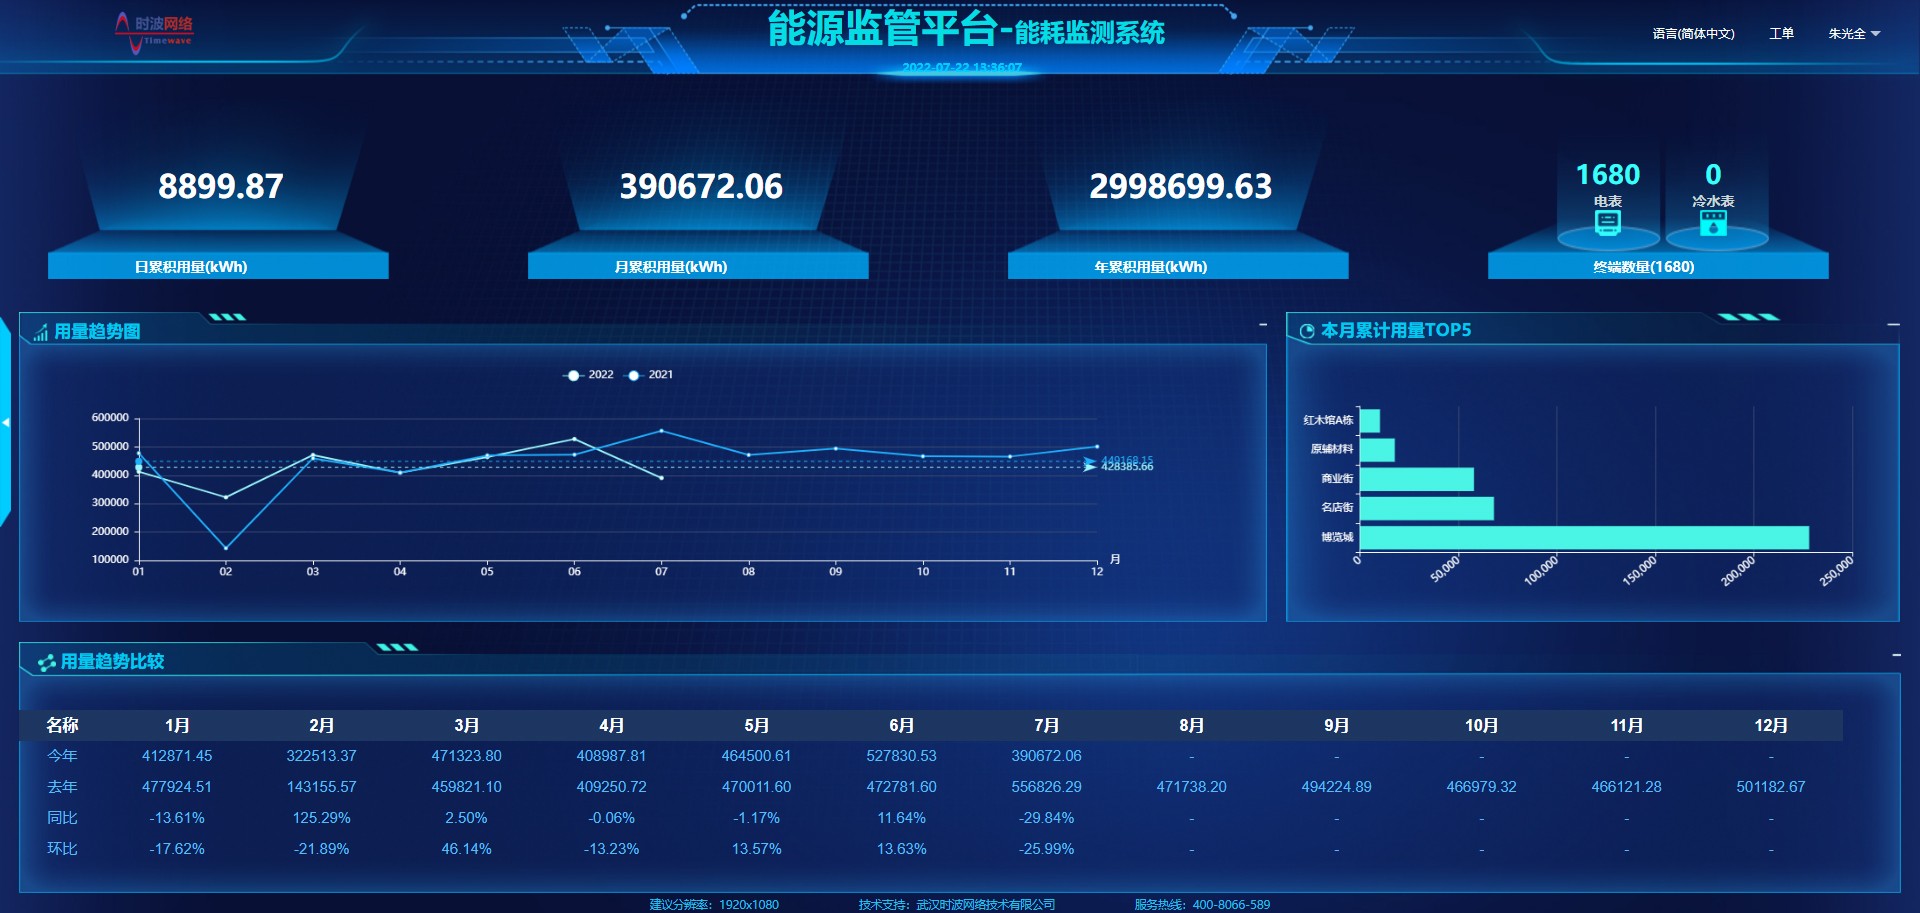
The home page contains daily cumulative usage, monthly cumulative usage, annual cumulative usage, terminal quantity, usage trend, current month cumulative usage, and usage trend comparison.
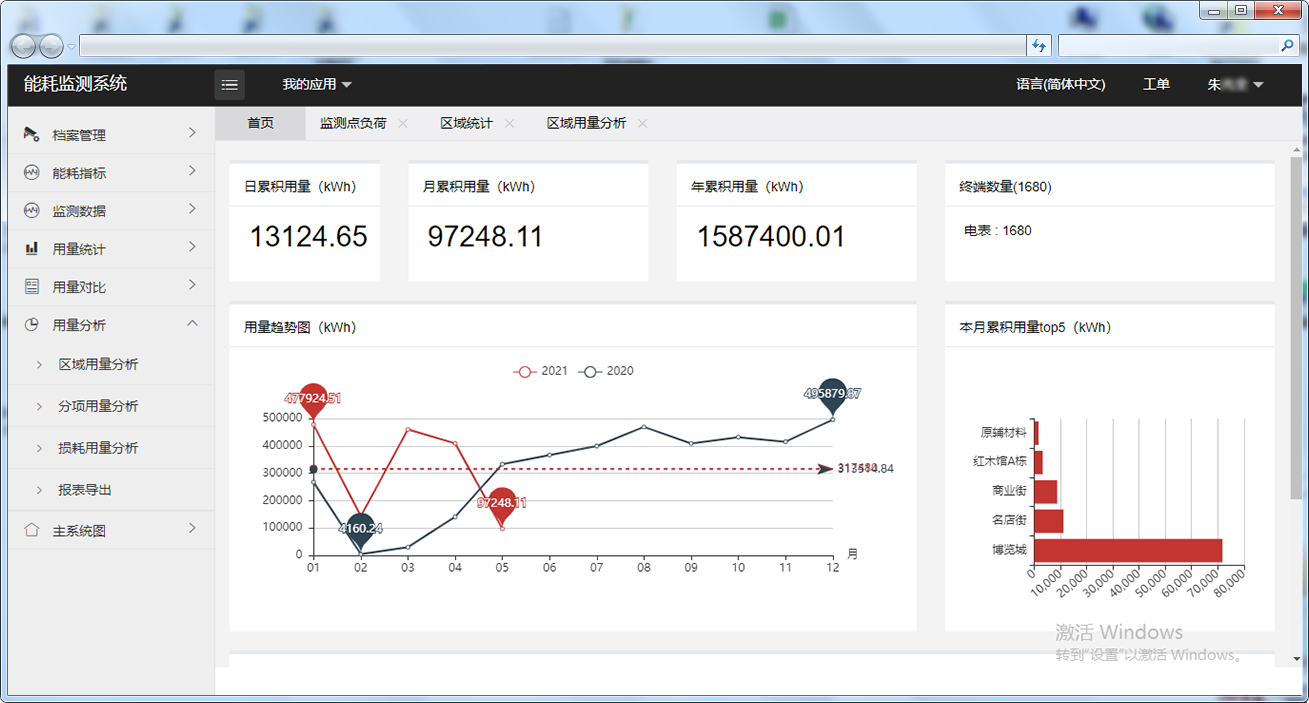
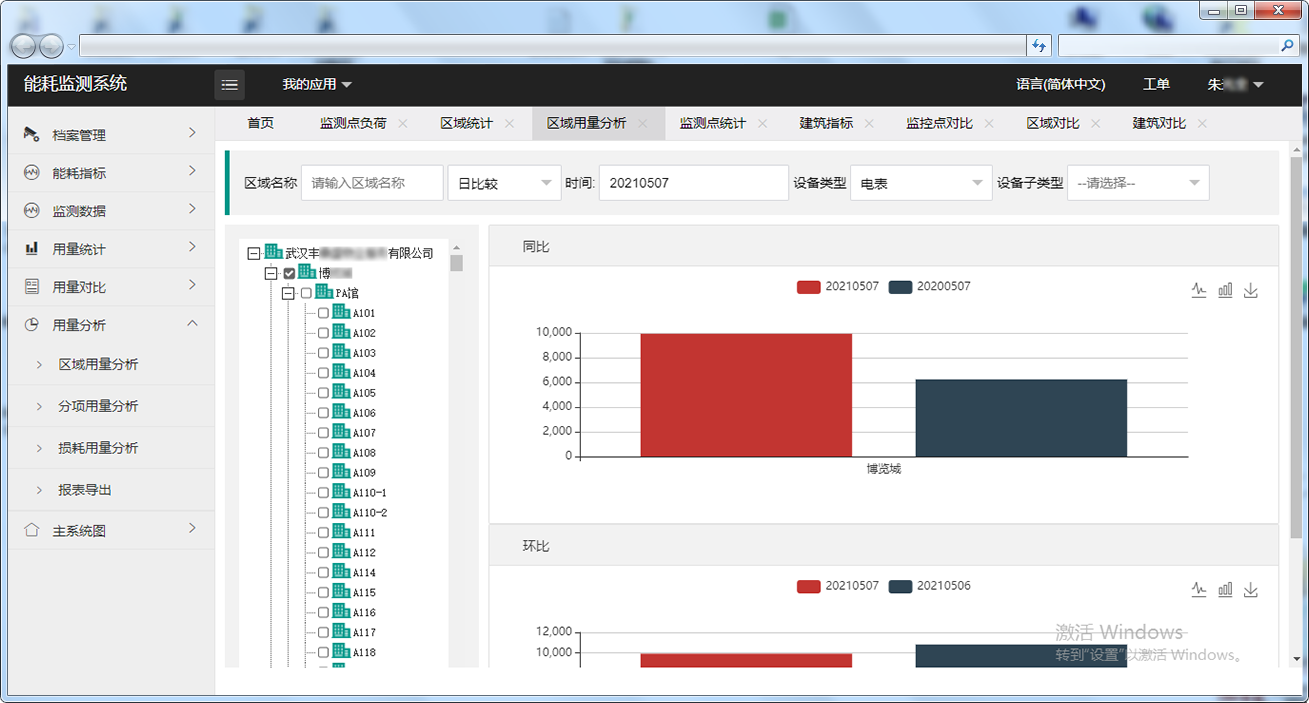
Enter the regional energy consumption statistics page, and select the corresponding region and time. You can query the energy consumption statistics in this area.
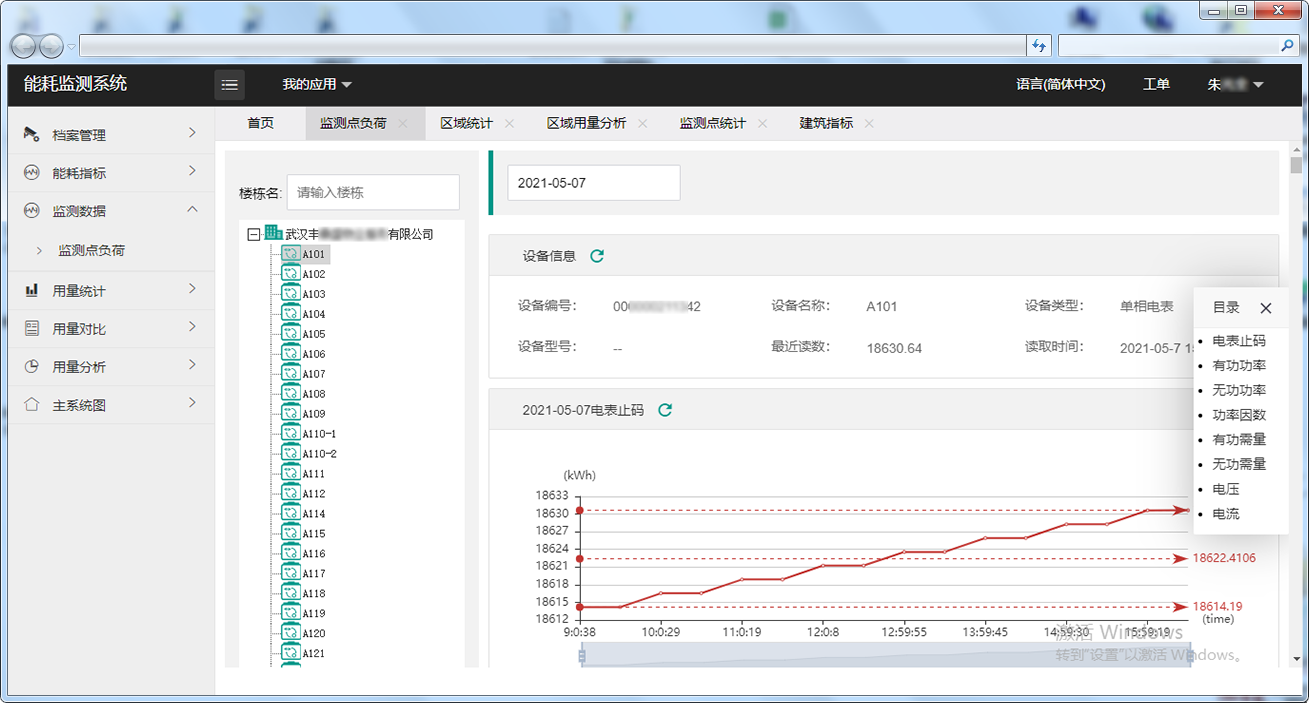
Enter the load page of monitoring point to query the information of relevant load items monitored.
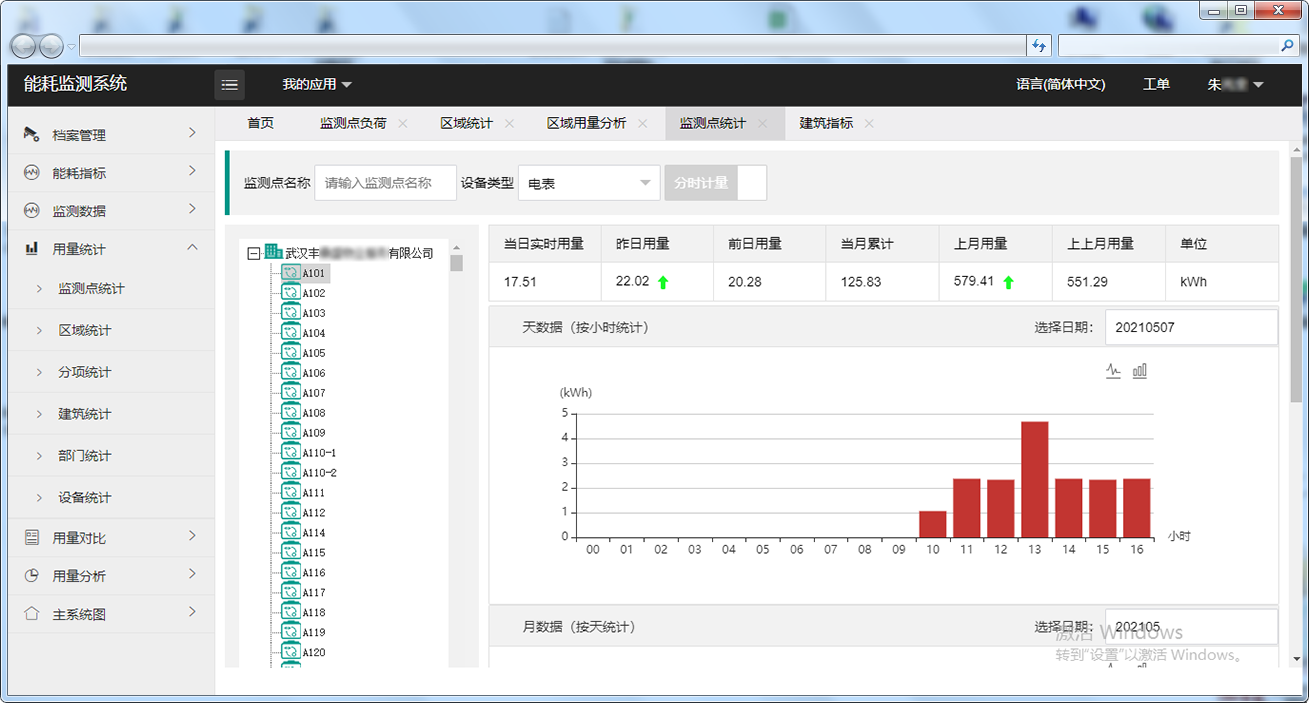
Enter the monitoring point statistics page. Enter the name of the monitoring point to query relevant information.

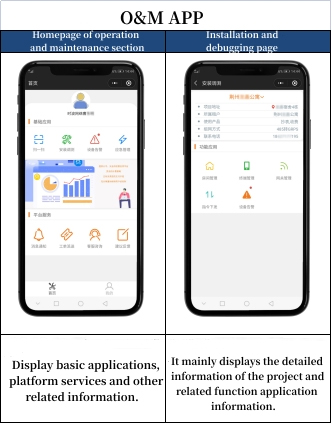
Mobile terminal interface
Large screen display homepage of energy supervision platform
- Previous: Low carbon energy-saving intelligent management system for energy users
- Next:None
You may like
-
 Online service
-
 Hotline
-
 WhatsApp
-


